VOLTA Scanner: High-Throughput Cardiomyocyte Electrophysiology with an Optical Pacemaker
In 2021, a team of researchers from Pfizer, Eli Lilly, and the University of Liverpool demonstrated the utility of Lumencor’s VOLTA Scanner together with human induced pluripotent stem cell-derived cardiomyocytes (hIPSC-CM) and BeRST, a voltage-sensitive fluorescent dye, for high-throughput cardiac electrophysiological preclinical safety profiling of drug candidates [1]. The team used the spontaneous beating of cultured hIPSC-CM monolayers to provide the necessary electrophysiological triggering for these assays. However, the spontaneous beating frequency of hIPSC-CM cultures is variable to some degree, depending on differentiation and maturation methods, environmental tissue culture conditions, and the somatic cell type of origin. Furthermore, electrophysiological responses and the effects of drugs on cardiac ion channels can be strongly beat rate-dependent, making the capacity for pacing cells to physiologically and pathophysiologically relevant frequencies an essential attribute for any cardiomyocyte screening platform [2].
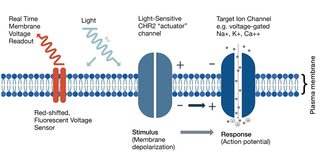
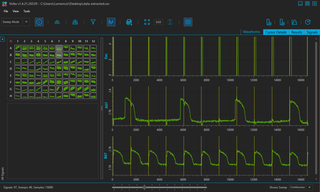
The VOLTA Scanner controls pacing optogenetically, using the 462 nm laser source in conjunction with the light-gated cation channel protein channelrhodopsin (ChR2) (Figure 1). Direct channelrhodopsin transfection of hIPSC-CM, in most cases using adeno-associated viral (AAV) or lentiviral vectors has been independently demonstrated by several groups [3, 4, 5]. ChR2-mediated stimulation also enables experimentation with cell types that do not exhibit spontaneous beating such as primary cardiomyocytes and 3-dimensional cardiac spheroid populations [6]. The timing, intensity, and duration of the 462 nm laser pulse supplied by the VOLTA Scanner for ChR2 stimulation are user-controlled, allowing experimental optimization of these parameters (Figure 2). Transmembrane action potential voltage changes are detected by measuring the fluorescence of BeRST dye, which is excited using the VOLTA Scanner’s 660 nm laser. The spectral separation of the 462 nm laser from the 660 nm laser ensures there is minimal optical crosstalk between stimulus and recording. While the 462 nm laser may introduce artifacts in the 660 nm signal, the VOLTA application removes this, to producing clean waveforms (Figure 2). Together with its unparalleled 0.1 ms kinetic resolution, the VOLTA Scanner’s optical pace-making capabilities present new opportunities for increasing the information content, enhancing cardiac toxicity detection sensitivity, and pharmacological predictability of high-throughput cardiac electrophysiology assays.

Figure 1. Schematic of optically-actuated membrane depolarization coupled with voltage-sensitive fluorescence detection as implemented on the VOLTA Scanner.

Figure 2. Kinetic fluorescence waveforms of hIPSC-CM collected on the VOLTA Scanner and displayed in the VOLTA application. The autoscaled 96-well plate miniature map is shown on the left, and the expanded waveforms of the selected wells (A07 and B07) are shown on the right. Cells were exposed to ~50 ms-pulses of 462 nm light (Excitation) every 1500 ms (indicated by the dashed yellow line) and were continuously exposed to 660 nm light. hIPSC-CM without ChR2 (well A07) beat spontaneously, as they are not stimulated by the 462 nm light. In contrast, hIPSC-CM with ChR2 (well B07) are optically stimulated by 462 nm light and beat every 1500 ms. Changes in transmembrane action potential voltage are detected by monitoring BeRST dye fluorescence (excitation at 660 nm) over time.
- Sep 18, 2024

- [1] P Kilfoil, SL Feng, S Jenkinson et al. (2021) Eur J Pharmacol 912:174584(opens in new window)
- [2] Y Hinata, Y Kagawa, T Shimizu et al. (2022) J Pharmacol Toxicol Methods 118:107228(opens in new window)
- [3] D Patel, J Stohlman, K Blinova et al. (2019) Toxicol Sci 170(1):167-179(opens in new window)
- [4] S Rehnelt, D Malan, P Sasse et al. (2017) Int J Mol Sci 18(12):2634(opens in new window)
- [5] A Klimas, G Ortiz, E Entcheva et al. (2019) Prog Biophys Mol Biol 154:62-70(opens in new window)
- [6] C Chua, J Han, W Li et al. (2021) Front Bioeng Biotechnol 9:658594-08.(opens in new window)


