In light microscopy, it is axiomatic that information is only obtainable from the portion of the specimen that is illuminated. Furthermore, it is self-evident, that if the illumination is not spatially uniform, then that non-uniformity will bias the image data. However, intentional biasing of the illumination field is foundational to many of the techniques for increasing the spatial resolution of fluorescence microscopy that have emerged in the past 25 years. In this paper, we will describe the spatial output characteristics of solid-state light sources and how they are propagated into imaging applications.
1. Solid-State Light Sources: Lasers and LEDs
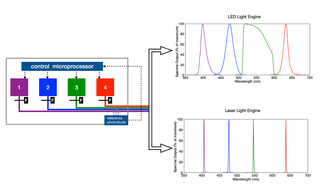
A Light Engine is a compact array of solid-state sources operating under a unified control infrastructure and feeding into a unified optical output path (Figure 1). The elements of the array may be LEDs or lasers or a hybrid of both, depending on the requirements of the intended application. In this paper, we will restrict consideration of lasers to diode lasers, which are similar in overall dimensions to LEDs, allowing them to be incorporated in arrays without fundamentally re-engineering the supporting infrastructure. At a practical level, LEDs and lasers differ in three important respects: (1) spectral distribution (Figure 1), efficiency of light output generation (Figure 2), and output spatial distribution (Figure 3). The narrower spectral bandwidths of lasers (Figure 1) are not particularly significant in fluorescence microscopy, as the spectral bandwidths of fluorescent dyes and fluorescent proteins are generally larger than those LEDs or lasers. Instead, it is output spatial distribution, most conveniently expressed as étendue [1] that primarily differentiates LEDs from lasers in terms of downstream applications. In prosaic terms, étendue is the product of the light emitting surface area of the device and the angular divergence of light from that area. Lasers, therefore, have much smaller étendue values than LEDs (Table 1). This makes LEDs primarily suited for widefield fluorescence microscopy working with two-dimensional samples across large fields of view with spatial resolution above the diffraction limit (>200 nm). Lasers better serve applications requiring high levels of radiance (Table 1) such as confocal microscopy, single-molecule localization microscopy and super-resolution microscopy.

Single LED sources used for fluorescence microscopy applications typically have an emitting surface of 1 mm x 1 mm. Light output from this surface has a Lambertian spatial distribution (Figure 3) which must be collimated and ultimately focused for use in the microscope. The étendue of the microscope limits how much of the Lambertian output distribution can be productively utilized. Typically, this is a cone of 60 degrees half-angle, representing about 90% of the total LED output. Diode lasers emit light from a resonant optical cavity formed in a multilayer semiconductor structure (Figure 4). The emitting area of a laser diode is about 4 orders of magnitude smaller (0.0001 mm2 versus 1 mm2) than that of an LED, making it possible to deliver similar power outputs within much smaller divergence angles. The transverse width of the laser cavity (emitter width, Figure 4) determines whether the laser is single mode (width <10 µm) or multimode (width >50 µm). In terms of applications, single and multimode diode lasers represent a trade-off between output power and angular divergence.
In addition to high radiance and small étendue (Table 1), light output from laser sources is coherent, whereas that from LEDs is not. When coherent light from a laser is randomized by reflection from an optically rough surface, the result is laser speckle (Figure 5). In applications requiring a uniform illumination field, laser speckle is obviously detrimental. In this case, various techniques for scrambling temporal or spatial coherence can be applied to the laser output [2]. On the other hand, laser speckle can be used to advantage for measurement of surface roughness or the motion of scattering particles. Notable among these applications is laser speckle contrast imaging (LCSI), used for measuring blood perfusion in tissues [3].
2. Output from Liquid Light Guides and Optical Fibers
Liquid light guides and optical fibers provide mechanically flexible conduits for delivering the light output from a Light Engine to downstream optical analysis systems such as microscopes. Liquid light guides generally have larger cross-sectional areas and larger angular acceptance ranges (numerical apertures) than optical fibers. Accordingly, optical fibers are typically (although not exclusively) used with laser Light Engines and liquid light guides with LED Light Engines. Characterization of the propagation of angular distribution of light generated by LED and laser Light Engines is presented in Figure 6. Figure 6 (a) shows the characterization methodology. From the known distance between the light delivery cord exit and the projection screen, projected radial light intensity values detected by the camera were converted to numerical aperture (NA) by application of NA = n.sinθ. Several salient features are demonstrated by the data in Figure 6. As expected, based on the characteristics described in Section 1, the angular distribution of LED Light Engines propagated by liquid light guides is wider than that of laser Light Engines propagated by multimode fibers (comparing panels (b) and (c) with panels (d) and (e)). The differences in angular distribution for different laser lines evident in panels (d) and (e) are attributable to the multimode output of the source lasers. With the addition of downstream beam-shaping optics (panels (f) and (g)), achromatic angular distributions are obtained. This characteristic is critically important in quantitative determination of molecular colocalization in cells and tissues using multicolor fluorescence microscopy [4].
3. Illumination for Fluorescence Microscopy
Köhler illumination (Figure 7) has been the dominant illumination method for widefield epifluorescence microscopy since its introduction in 1893 [5]. One of the primary motivations in the development of Köhler illumination was non-uniformity of illumination originating from the filaments of incandescent lamps or the wandering or fluttering of discharge lamp arcs. Köhler illumination eliminates these problems by situating the light source out-of-focus at the imaging sample plane (Figure 7). Solid-state light sources such as lasers and LEDs are intrinsically more spatially uniform, making implementation of critical illumination, where the source is in focus at the image plane (Figure 7), more practicable. Irradiance levels of 1–100 mW/mm2 at the sample plane provided by Köhler illumination from LEDs are sufficient for widefield fluorescence microscopy. However, Köhler illumination is relatively inefficient, as it does not propagate the full area, or the full angular distribution of light emitted from the source. For specialized imaging techniques such as single-molecule localization microscopy (SMLM), higher irradiance levels on the order of 10,000 mW/mm2 (1 kW/cm2) [6] are required. These may be achieved using a critical epi-illuminator that delivers more than 50% of the output power from a laser Light Engine output to the sample plane (Figure 8). The critical epi-illuminator produces uniform, high-irradiance illumination across an area that is matched to the area of the sCMOS camera sensor used for imaging.
Spinning disk confocal microscopy (SDCM) makes use of critical illumination to compensate for the light throughput attrition resulting from the imposition of spatial filtering to reject out-of-focus light [7]. Early implementations of SDCM used single-mode lasers coupled to the scan head (Yokogawa Electric, Tokyo) by single-mode fibers. However, this arrangement is prone to optical misalignment and often produces non-uniform illumination at the sample plane. Substantial improvements have been achieved by the ZIVA Light Engine (Lumencor, Beaverton, OR). The ZIVA Light Engine incorporates seven multimode laser sources with wavelength selection by direct electronic on/off switching, without the encumbrance of accessory output modulators such as acousto-optic tunable filters (AOTFs). The Light Engine incorporates beam shaping and despeckling optics producing a square illumination profile matching the form factor of the sCMOS sensor that records the image of the specimen (Figure 5). Light output is coupled to the Yokogawa CSU-W1 scanner through a precision-engineered adapter producing intense and uniform illumination at the sample plane. By dispensing with intermediate optical elements such as AOTFs and coupling fibers, light throughput is improved, and the size and cost of the system is reduced relative to single-mode laser launches.
Total internal reflection microscopy (TIRF) eliminates imaging of out-of-focus light by spatial confinement of fluorescence excitation to within 100 nm of the sample plane (for comparison, the z-axial resolution of SDCM is about 500 nm). TIRF is most commonly accomplished by focusing a laser to a ~50 µm diameter spot at the back focal plane of a very high numerical aperture objective (“objective TIRF”, [8]). However, illumination for TIRF can also be effectively accomplished by projecting the output of an LED through an annular mask onto the objective back focal plane [9]. The high magnification objectives required for objective TIRF result in limited fields of view. This limitation can be overcome using waveguide TIRF in which the sample is placed directly on a high refractive index glass coverslip that is edge-coupled to illumination supplied by LEDs or lasers [10].
In conclusion, LEDs and lasers are clearly differentiated in terms of spectral distribution, electro-optical conversion efficiency and output spatial distribution. Of these, spatial distribution is the most significant in defining their applications. Even so, there is considerable crossover between laser applications and LED applications, which is facilitated by the capacity to accommodate both types of light sources within a common control and optical infrastructure. Ultimately, it is only with the careful consideration of spatial distribution, alongside spectral and intensity specifications tailored to the analytical and imaging instrument needs, that the appropriate illumination can be built in service of the host of diverse life and materials science applications demanding photonic support.
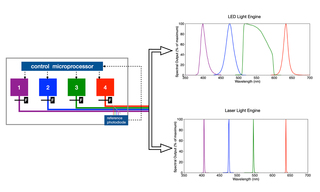
Figure 1. Schematic of a Light Engine consisting of an array of 4 solid-state sources. In practice, the number of sources can be from 2–21, depending on application requirements. The sources may be LEDs (generating spectral output shown top right) or lasers (generating spectral output shown lower right). LEDs may be filtered ( F ) to select a subset of the LED spectral output.
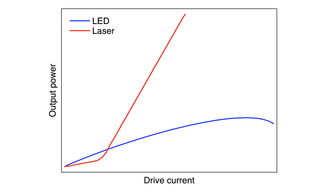
Figure 2. Light output versus drive current relationships for LEDs and lasers. LEDs generate light output from electric current passing through the p–n junction of a semiconductor. Diode lasers are similar except that light generation is confined to a small cavity within the semiconductor (Figure 4) where it is undergoes amplification, resulting in higher output power at most drive current levels.
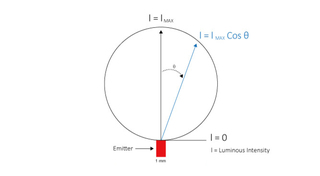
Figure 3. Lambertian spatial distribution of light output from an LED. Fluorescence microscopy applications typically utilize light output for ϴ from zero to 60°.
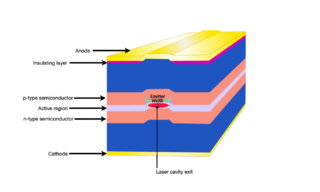
Figure 4. Schematic representation of a Fabry-Perot (FP) diode laser. The overall device is typically 1000 µm x 500 µm x 200 µm (length x width x height). The emitter width is <10 µm for single-mode lasers or >50 µm for multimode lasers with a height of 1 µm.
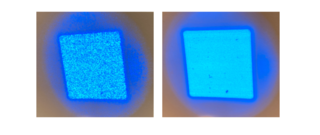
Figure 5. Left. Laser speckle pattern generated by 488 nm laser output from a ZIVA Light Engine (Lumencor, Beaverton, OR). Right. Same 488 nm laser output after passing through a rotating diffuser despeckler.
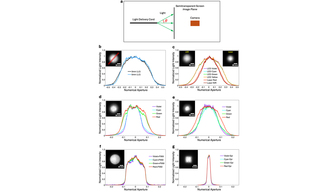
Figure 6. (a) Method for characterization of angular light distributions. The projected radial light distribution was captured by a Thorlabs DCC1240M CMOS camera. (b) Angular distributions of unfiltered white light (380–760 nm) generated by a SOLA V-N LED Light Engine (Lumencor, Beaverton, OR) after transmission through liquid light guides with 3 mm or 5 mm diameter cross-sections. (c) Angular distributions of filtered LED and laser light generated by a multisource SPECTRA Light Engine (Lumencor, Beaverton, OR) after transmission through a liquid light guide with 3 mm cross-section. Violet LED = 395 nm, Cyan LED = 475 nm, Green LED = 555 nm, Yellow = 575 nm, all with 25 nm bandpasses. Laser center wavelengths are 637 nm (Red) and 748 nm (NIR). (d) Angular distributions of light generated by a CELESTA Light Engine (Lumencor, Beaverton, OR) after laser transmission through a multimode optical fiber with 1.5 mm diameter cross-section (NA = 0.39). Laser center wavelengths are 405 nm (Violet) 477 nm (Cyan), 545 nm (Green) and 639 nm (Red). (e) Angular distributions of light generated by a CELESTA Light Engine (Lumencor, Beaverton, OR) after transmission through a multimode optical fiber with square 0.4 mm x 0.4 mm cross-section (NA = 0.22). Laser center wavelengths are 405 nm (Violet) 477 nm (Cyan), 545 nm (Green) and 639 nm (Red). (f). Same as (e) but with light output from the distal end of the fiber passed through a Thorlabs F950 multimode collimator. (g). Same as (e) but with light output from the distal end of the fiber passed through a Lumencor critical epilluminator (see also Figure 8).
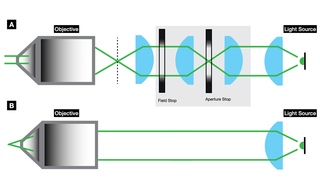
Figure 7. Optical schematics of (A) Köhler illumination and (B) critical illumination. The vertical dashed line in panel A represents the back focal plane of the objective.
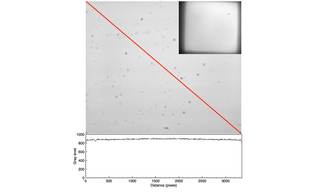
Figure 8. Uniform fluorescent glass imaged with a CELESTA Light Engine coupled by an 800 µm diameter optical fiber to a critical epi-illuminator installed in a Nikon Ti/Ti2 microscope. Image capture using Nikon 60X/1.4 NA Plan Apo objective and an Andor Zyla 5.5 (2560 x 2160 pixels) sCMOS camera. The plot shows the gray level values recorded by the camera along the diagonal axis marked in red. The inset in the upper right-hand corner shows the same sample imaged with a Nikon 10X/0.3 NA Plan Apo objective.
- Feb 10, 2025
- [01] W Mönch (2015) Adv Opt Techn 4:79–85(opens in new window)
- [02] V Kumar, AK Dubey DS Mehta et al. (2021) Opt Laser Technol 141:107079(opens in new window)
- [03] W Heeman, W Steenbergen, EC Boerma et al. (2019) J Biomed Opt 24:1–11(opens in new window)
- [04] J Waters (2009) J Cell Biol 185:1135–1148(opens in new window)
- [05] A Nolte, JB Pawley L. Höring (2006) in Handbook of Biological Confocal Microscopy, (3rd Edition), JB Pawley (Ed) pp 126–144(opens in new window)
- [06] R Diekmann, M Kahnwald, J Rise et al. Nat Methods (2020) 17:909–912(opens in new window)
- [07] J Oreopoulos, R Berman, M Browne (2014) Methods Cell Biol 123:153–175(opens in new window)
- [08] A Yildiz, RD Vale (2015) Cold Spring Harb Protoc; doi:10.1101/pdb.top086348(opens in new window)
- [09] C Suckert, C Zosel, M Schaefer (2024) Cell Calcium 120:102883(opens in new window)
- [10] S Ramachandran, DA Cohen, R Lal et al. (2013) Sci Rep 3:2133 (opens in new window)


